Table Panel
The Table panel renders the result set as a table.
If the result of the command is a graph, then both vertices and edges will be flattened into a table.
If the result has documents, they will be displayed in table format as well.
Connections to other records (like edges in vertices) are not displayed in the table, but only the number of connection is reported.
In the example below @in is the number of incoming edges for each vertex, and @out the number of outgoing edges.
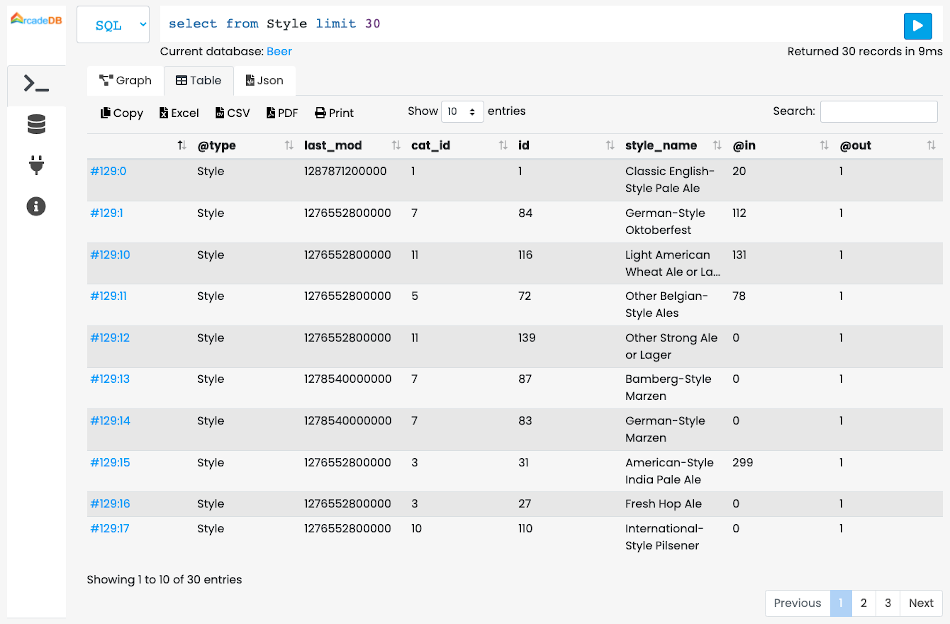
By clicking on the RecordID (RID) (always the first column), the record will be displayed in the graph view with all its attributes.
The Table View automatically layout the records in pages. You can select the amount of records per page and moving between pages with the toolbar at the bottom of the table.
To quick search a record, type what you’re looking for in the Search input field.
The filtering works in real-time as soon as you type.
The filtering only applies on the current result set.
The table can be exported in the following formats:
-
Copy, to copy the entire content in the clipboard. You can then paste the content into your favorite editor or document with CTRL+V or CMD+V.
-
Excel, for Microsoft® Excel format
-
CSV (Comma Separated values)
-
PDF to export the entire table in PDF format
-
Print to print all the pages of the table