Query Panel
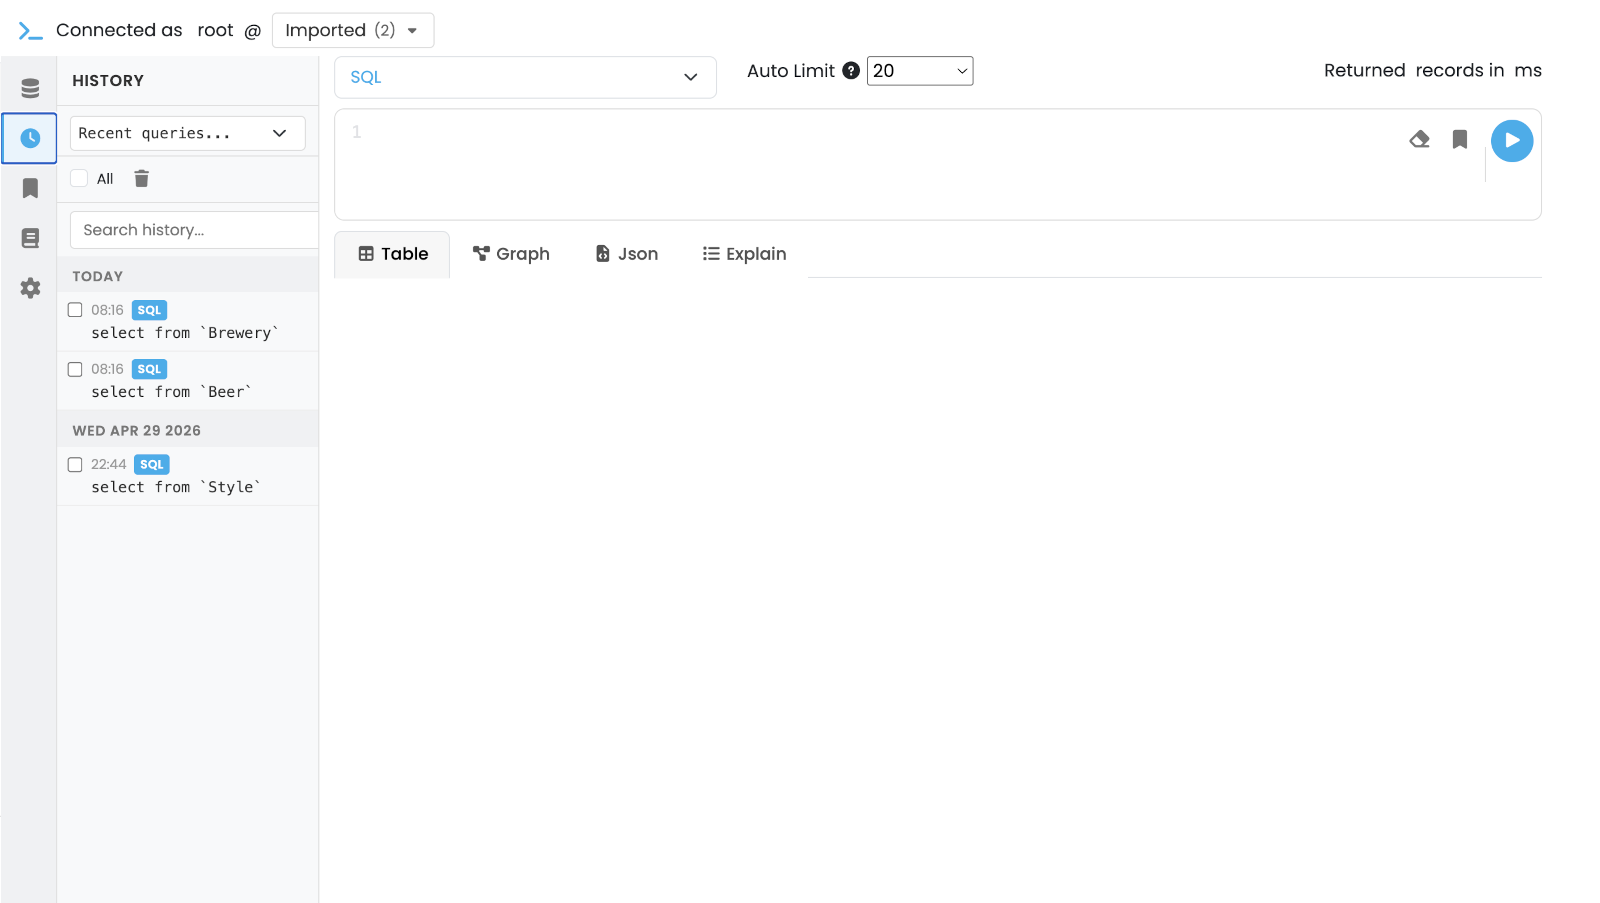
The Query panel is the everyday workspace: write a command in any supported language, run it against the selected database, and inspect the result as a table, a graph, a JSON document, or an execution plan.
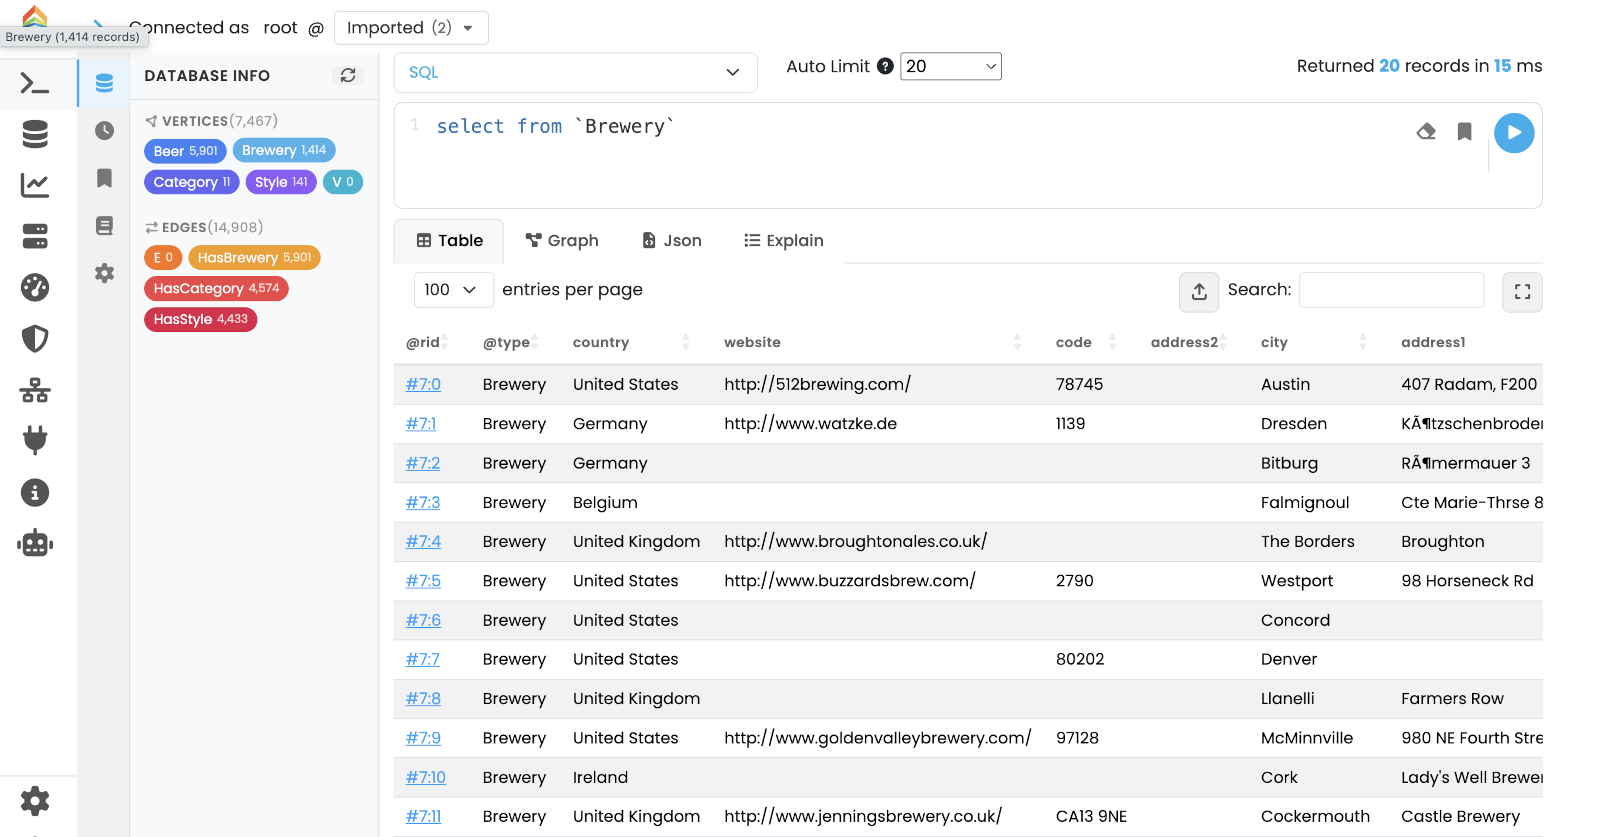
The header shows the current user and the Database Selector; pick the database to run against here.
The status bar at the top right reports Returned X records in Y ms after every execution.
Left icon sidebar
The narrow icon column on the left of the editor switches between auxiliary panes; the main editor and results stay in place.
-
Overview — summary information about the selected database (default view).
-
History — list of recently executed commands. Click an entry to load it back into the editor.
-
Saved — saved queries. Use the Save Query button in the editor toolbar to add the current command to this list.
-
Reference — searchable reference of SQL functions and methods plus quick links to the other query languages.
-
Settings — editor preferences (theme, font size, key bindings).
Editor and toolbar
The editor is a CodeMirror instance with syntax highlighting that follows the selected language.
The toolbar above the editor exposes:
-
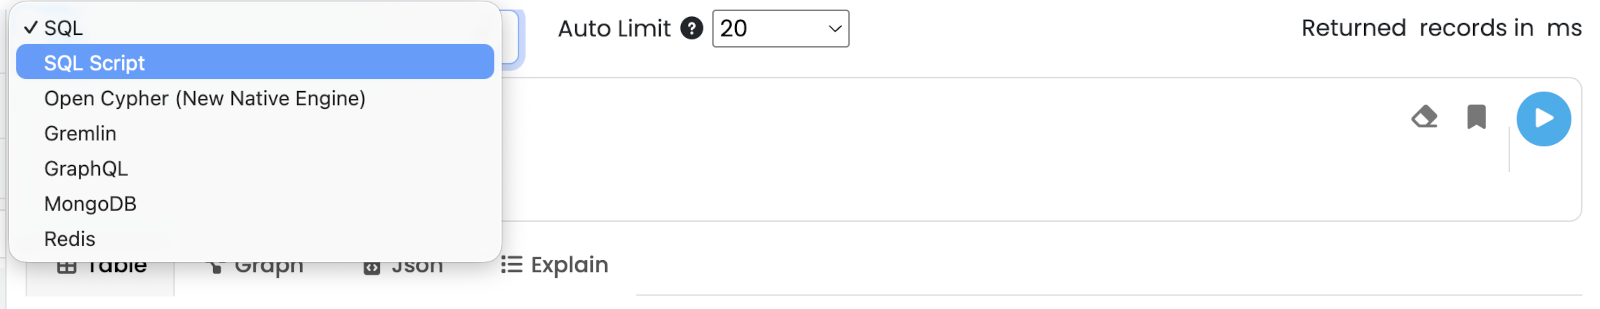
Language selector with: SQL, SQL Script (multi-statement), Open Cypher (native engine), Apache TinkerPop Gremlin, GraphQL, MongoDB, Redis.
-
Auto Limit dropdown — caps the number of rows returned by interactive runs (
20,50,100,500, No Limits). Useful to stay safe on large datasets; the cap is applied as aLIMITwhen the language supports it. -
Clear — empties the editor.
-
Save Query — adds the current command to the Saved pane in the sidebar.
-
Run (or Ctrl+Enter / Cmd+Enter) — executes the command.
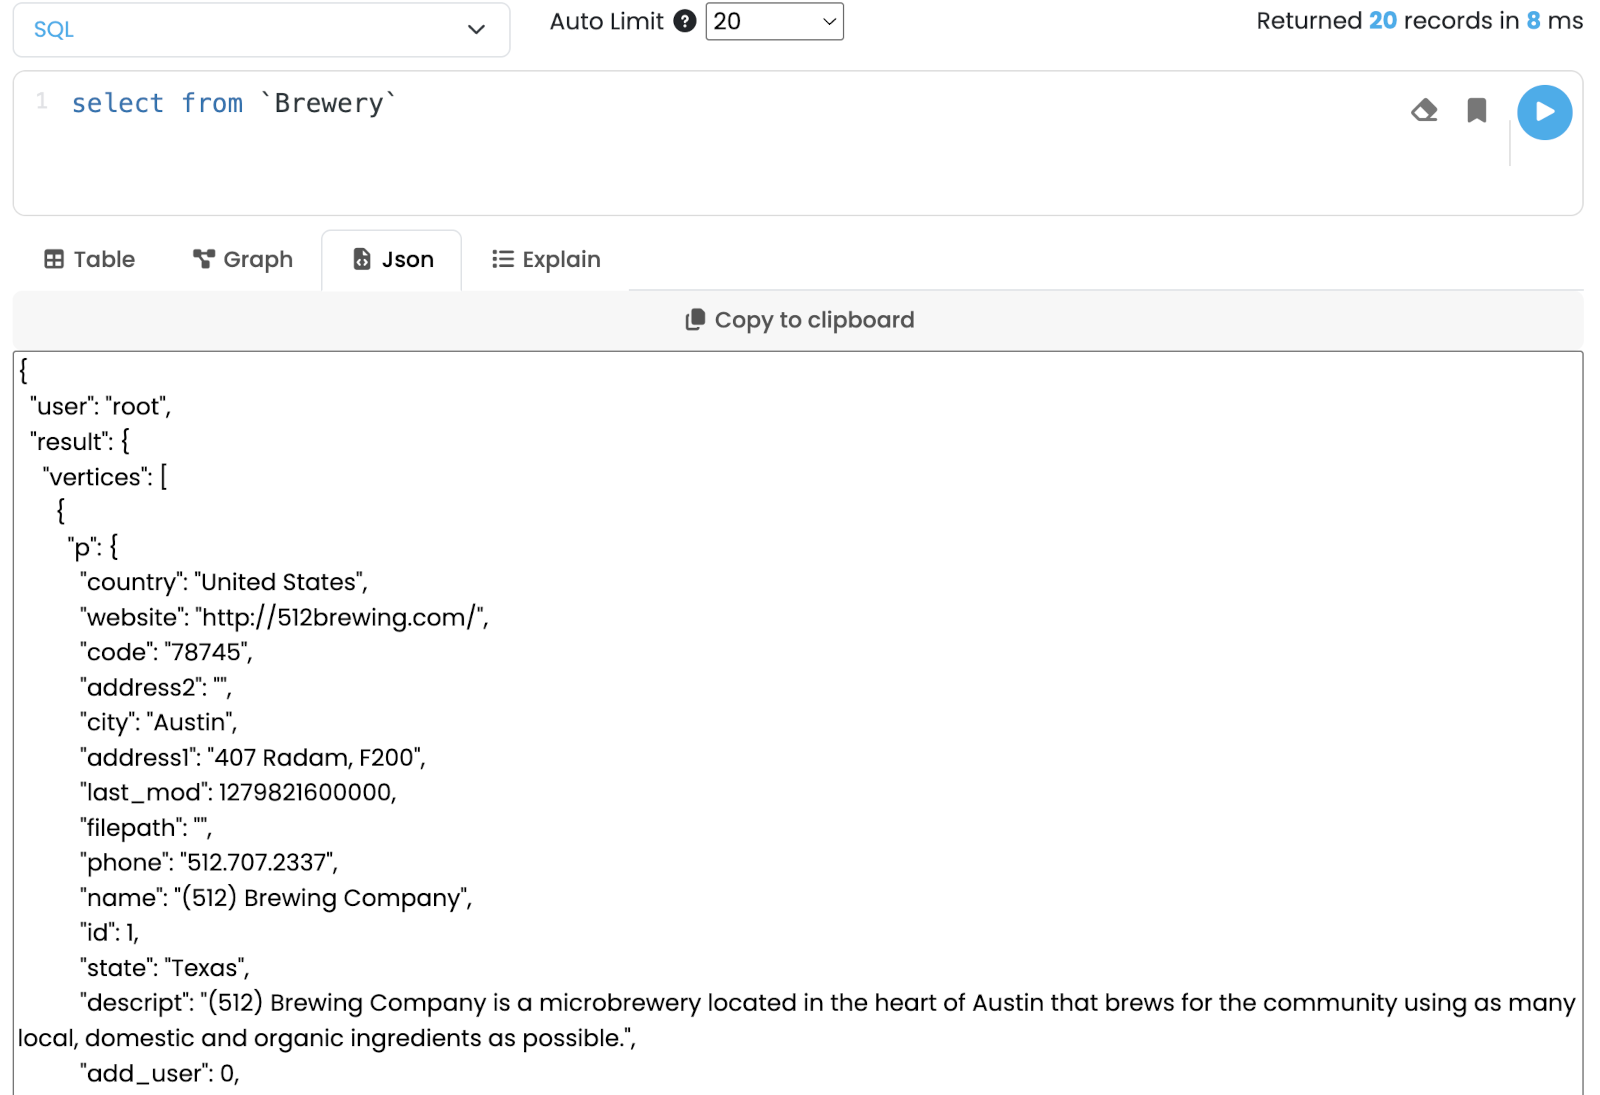
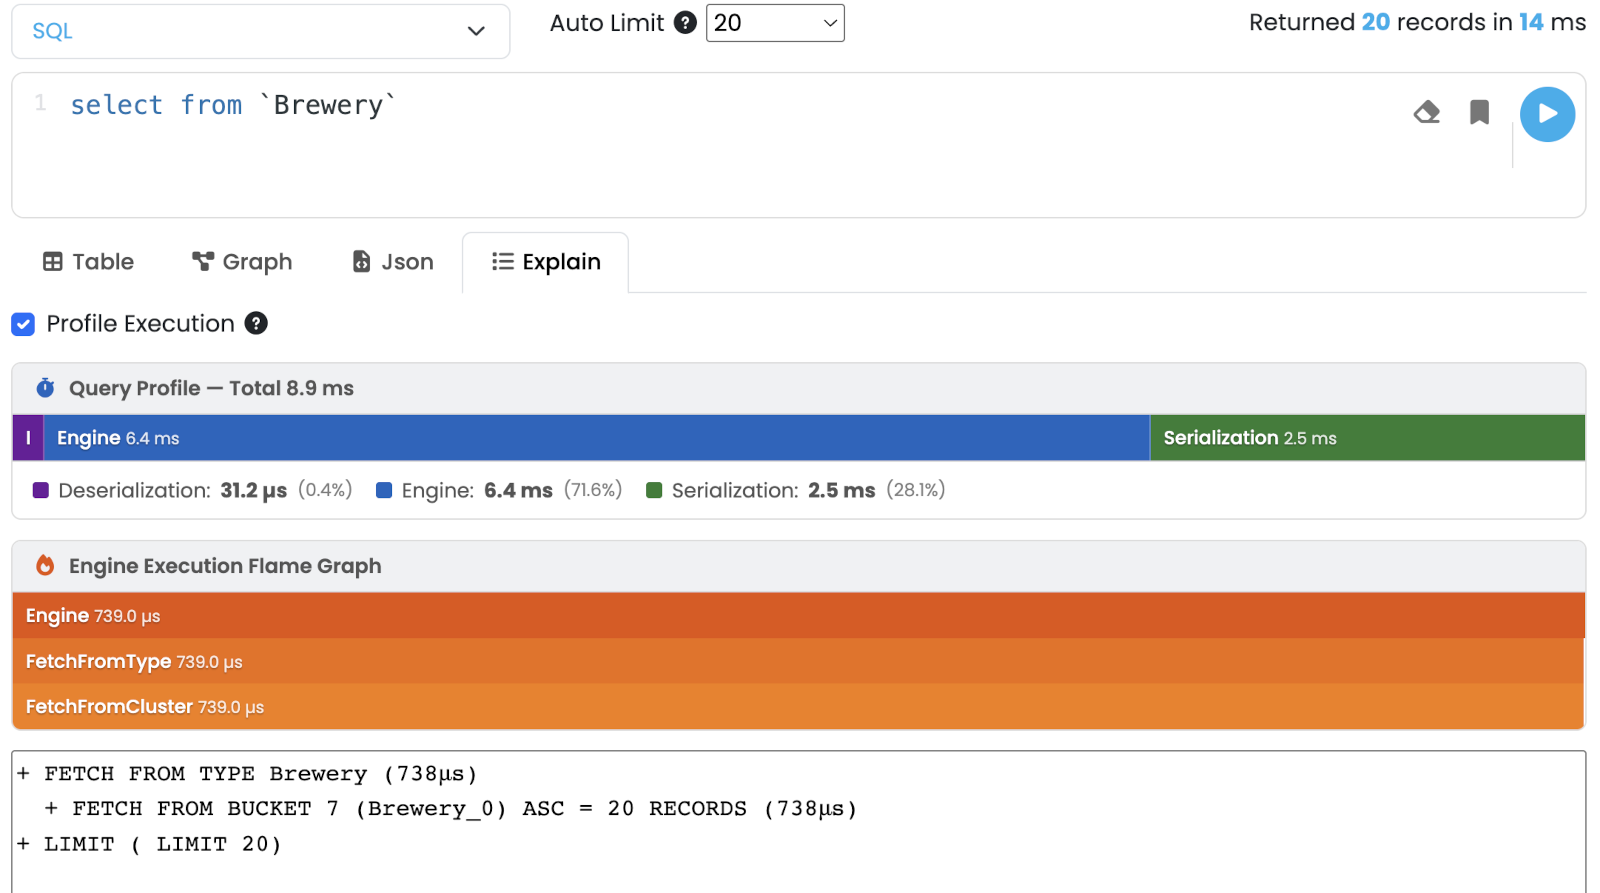
Result views
The result area sits below the editor and exposes four tabs. Studio automatically picks the most appropriate one for the result type, but you can switch at any time.
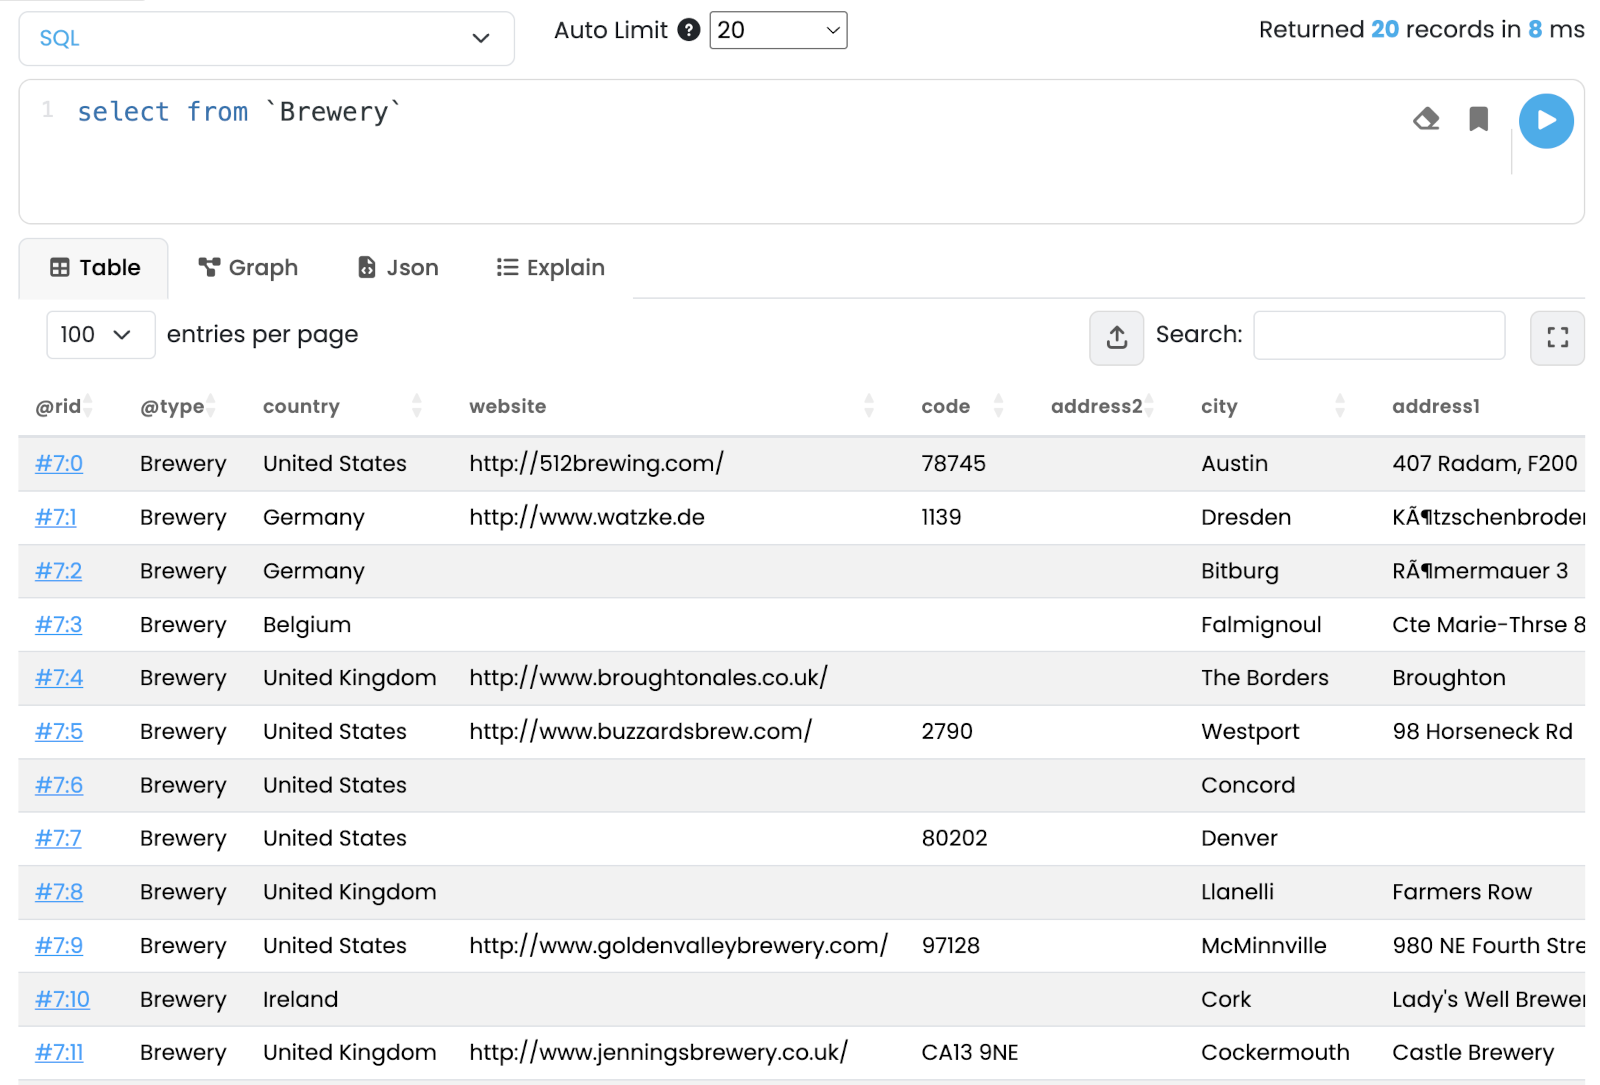
Table
Tabular view backed by DataTables with sorting, paging and per-column search.
-
Click a cell to open the Record Editor in a modal overlay, where you can edit fields and save the record back to the database.
-
The header tools allow exporting the current result to CSV.
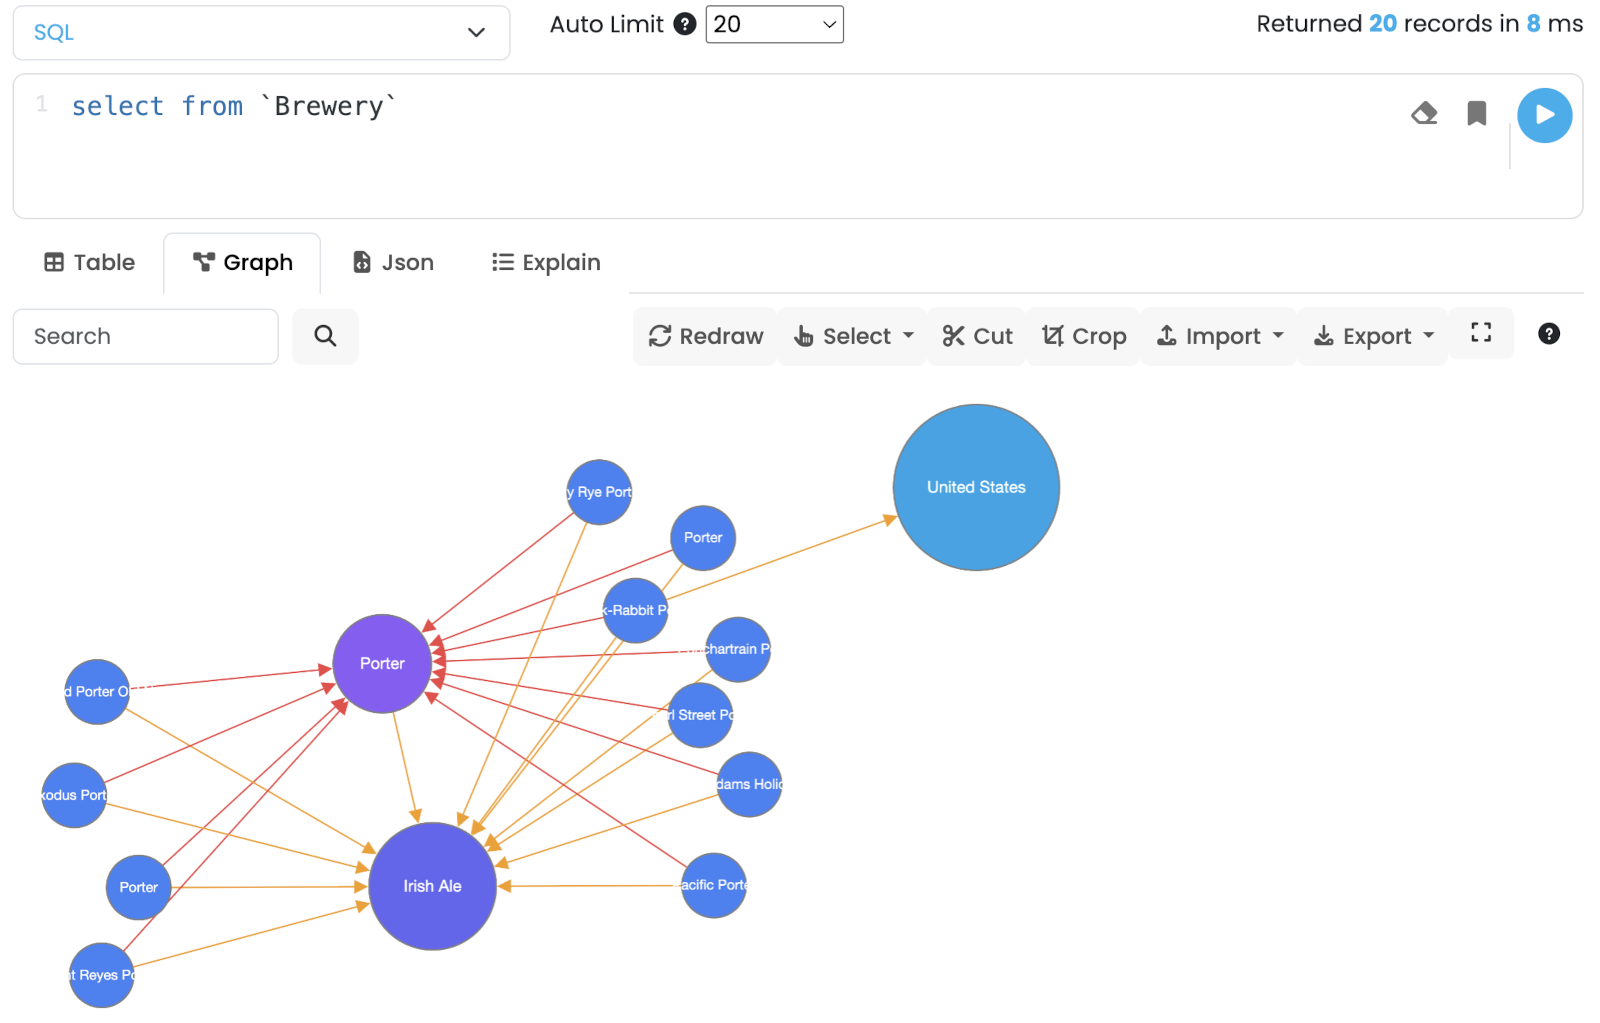
Graph
Force-directed graph view powered by Cytoscape.js. Vertices and edges returned by the command are added to the canvas; existing nodes are kept so you can incrementally explore the graph.
Toolbar actions:
-
Search — locate a node by
@ridor a property value. -
Redraw — reapply the layout.
-
Select — selection helpers: Direct Neighbors, Orphans, Invert Selection, Shortest Path.
-
Cut / Crop — remove the selected nodes / keep only the selected nodes.
-
Import / Export — JSON, GraphML, PNG, JPEG.
-
Settings — per-type style overrides (label, color, size, icon).
-
Fullscreen — expand the canvas to the full browser window.
Interactions:
-
Click on a node selects it; Cmd/Ctrl-drag rubber-bands a block selection.
-
Hold the mouse on a node opens its context menu (load neighbors, edit, delete).
-
Double-click on a node loads its direct neighbors.